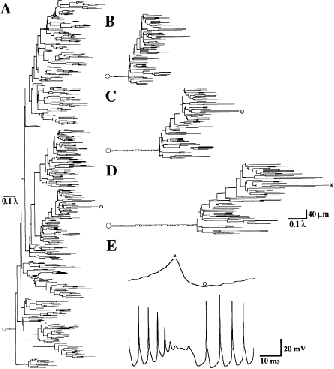
| Figure 1: | Effect of voltage-dependent conductances on the electrotonic
length of dendritic segments. A : Full Sholl diagram in units of electrotonic
length of the cell with active conductances in the dendrites, during a pause in
between action potentials. B–D: Enlargement of the Sholl diagram showing
the same subset of branchlets (original location indicated by circle in A) under
different conditions of the ionic channels. B: All passive membrane. C: Active
membrane; the cell is in a quiet state in between action potentials (same as
A). D: Active membrane at the peak of a dendritic spike. E: Recording of
activity in a spiny dendrite (top trace, location marked on the Sholl diagrams)
and soma (bottom trace). Dendrogram D was taken at the time indicated by
the asterisk. Dendrogram C was taken at the time indicated by the circle.
Simulation of 2.0 nA current injection in the soma, model PM9. |