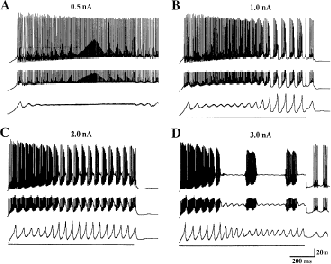
| Figure 1: | Simulation of current injection in the soma, model PM9. For each
current injection amplitude (A: 0.5 nA, B: 1.0 nA, C: 2.0 nA, D: 3.0 nA) 3
recording sites are shown: the soma (top trace), the main dendrite (middle
trace), and a spiny dendrite (bottom trace). Bar below traces: duration of
current injection. |